File Size: 42367KB
Total Views: 60809
Date Created:
Last Modified Date:
Official Website: Go to website
License: MIT
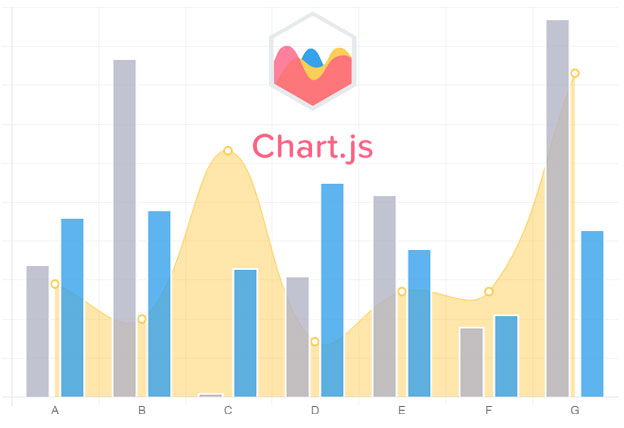
Chart.js could be a simple, flexible and totally customizable jQuery chart plugin that helps you to draw bar, line, area, scatter, doughnut, pie, polar, radar and many more charts.
It’s easy to get started with Chart.js. All that is needed is that the script enclosed in your page beside one canvas tag to render the chart.
Features:
- Chart.js can be installed via
npmorbower. - Supports bar charts, line charts, area charts, scatter charts, doughnut charts, pie charts, polar area charts, radar charts and many more.
- Works with tablet and mobile devices.
How to use it:
1. Include the Javascript Chart.min.js at the bottom of the web page.
<script src="https://cdn.jsdelivr.net/npm/chart.js@2.9.0/dist/Chart.min.js"></script>2. Initialize the chart plugin to create a chart.
var ctx = document.getElementById('myChart').getContext('2d');
var chart = new Chart(ctx, {
  // The type of chart we want to create
  type: 'bar',
  // The data for our dataset
  data: {
      labels: ['January', 'February', 'March', 'April', 'May', 'June', 'July'],
      datasets: [{
          label: 'My First dataset',
          backgroundColor: 'rgb(255, 99, 132)',
          borderColor: 'rgb(255, 99, 132)',
          data: [0, 10, 5, 2, 20, 30, 45]
      }]
  },
  // Configuration options go here
  options: {
    responsive: true,
  }
});
3. Add canvas to the page with the specific ID myChart.
<canvas id="myChart"></canvas>Configuration options for responsive:
| Name | Type | Default | Description |
|---|---|---|---|
| responsive | boolean | true |
Resizes the chart canvas when its container does. |
| responsiveAnimationDuration | number | 0 |
Duration in milliseconds it takes to animate to new size after a resize event. |
| maintainAspectRatio | boolean | true |
Maintain the original canvas aspect ratio (width / height) when resizing. |
| aspectRatio | number | 2 |
Canvas aspect ratio (i.e. width / height, a value of 1 representing a square canvas). Note that this option is ignored if the height is explicitly defined either as attribute or via the style. |
| onResize | function | null |
Called when a resize occurs. Gets passed two arguments: the chart instance and the new size. |
<div class="chart-container" style="position: relative; height:40vh; width:80vw">
    <canvas id="chart"></canvas>
</div>
Configuration options for Fonts:
| Name | Type | Default | Description |
|---|---|---|---|
| defaultFontColor | Color | '#666' |
Default font color for all text. |
| defaultFontFamily | string | "'Helvetica Neue', 'Helvetica', 'Arial', sans-serif" |
Default font family for all text. |
| defaultFontSize | number | 12 |
Default font size (in px) for text. Does not apply to radialLinear scale point labels. |
| defaultFontStyle | string | 'normal' |
Default font style. Does not apply to tooltip title or footer. Does not apply to chart title. |
Chart.defaults.global.defaultFontColor = 'red';
let chart = new Chart(ctx, {
    type: 'line',
    data: data,
    options: {
        legend: {
            labels: {
                // This more specific font property overrides the global property
                fontColor: 'black'
            }
        }
    }
});
Configuration options for Animation:
| Name | Type | Default | Description |
|---|---|---|---|
| duration | number | 1000 |
The number of milliseconds an animation takes. |
| easing | string | 'easeOutQuart' |
Easing function to use. |
| onProgress | function | null |
Callback called on each step of an animation. |
| onComplete | function | null |
Callback called at the end of an animation. |
var chart = new Chart(ctx, {
    type: 'line',
    data: data,
    options: {
        animation: {
            onProgress: function(animation) {
                progress.value = animation.animationObject.currentStep / animation.animationObject.numSteps;
            }
        }
    }
});
Types of Easing 'linear', 'easeInQuad', 'easeOutQuad', 'easeInOutQuad', 'easeInCubic', 'easeOutCubic', 'easeInOutCubic', 'easeInQuart', 'easeOutQuart', 'easeInOutQuart', 'easeInQuint', 'easeOutQuint', 'easeInOutQuint', 'easeInSine', 'easeOutSine', 'easeInOutSine', 'easeInExpo', 'easeOutExpo', 'easeInOutExpo', 'easeInCirc', 'easeOutCirc', 'easeInOutCirc', 'easeInElastic', 'easeOutElastic', 'easeInOutElastic', 'easeInBack', 'easeOutBack', 'easeInOutBack', 'easeInBounce', 'easeOutBounce', 'easeInOutBounce'
Configuration options for layout:
| Name | Type | Default | Description |
|---|---|---|---|
| padding | number|object | 0 |
The padding to add inside the chart. |
let chart = new Chart(ctx, {
    type: 'line',
    data: data,
    options: {
        layout: {
            padding: {
                left: 50,
                right: 0,
                top: 0,
                bottom: 0
            }
        }
    }
});


